Fundamental Analysis
The Nasdaq 100 index has posted a sharp decline in recent sessions, driven primarily by rising U.S. Treasury yields. On May 21, the 30-year yield surged to 5.1%, its highest level since 2023, following a 20-year bond auction that raised concerns about the growing U.S. fiscal deficit. The spike in yields has increased the cost of capital, weighing heavily on growth stocks, particularly in the tech sector, causing the Nasdaq to drop 1.4% that day.
Technical Analysis
US100 | H2
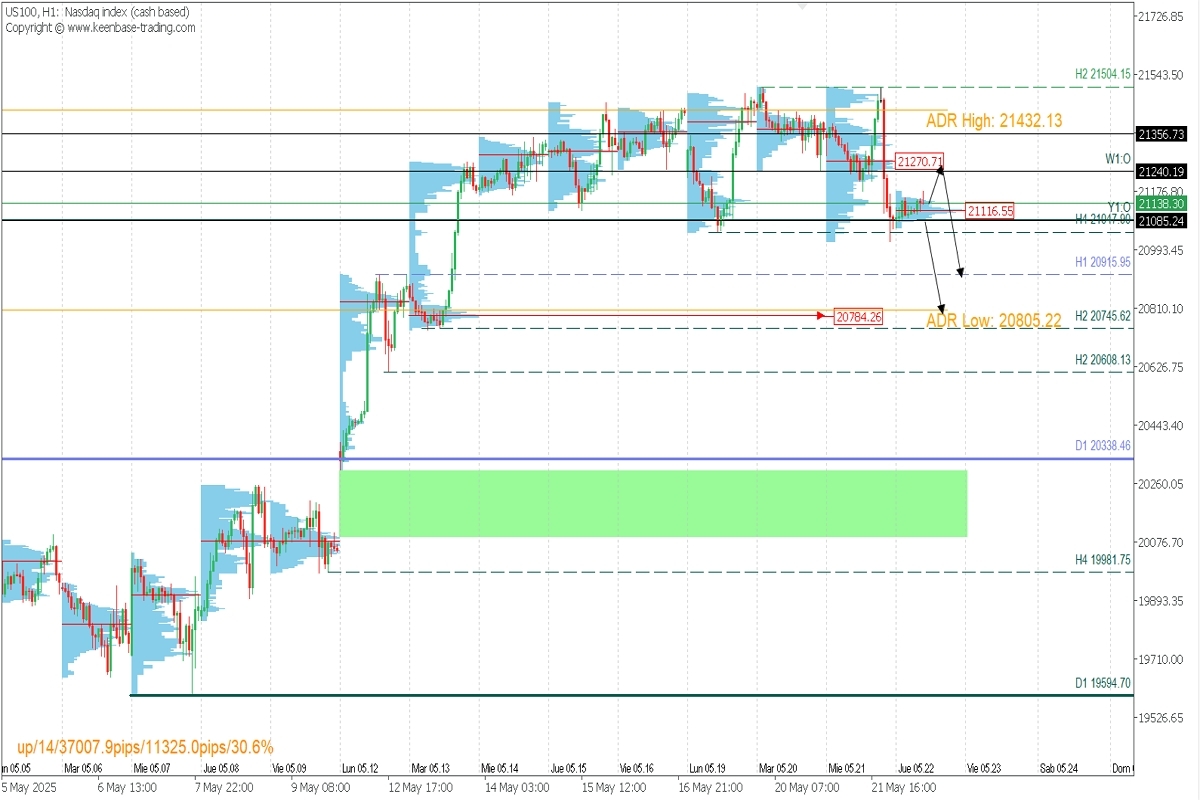
Supply Zone (Sell): 21270
Demand Zone (Buy): 20784.26
US100 is consolidating after a technical rejection from the key resistance level at 21504.15, signalling potential for further weakness. Wednesday’s sharp decline broke through the intraday support at 21047.99, leaving an active supply zone around 21270.71. The current price action shows volume and price compression with no clear bullish momentum or continued bearish follow-through at this stage.
The POC (Point of Control) from earlier sessions at 21116.65 becomes a decisive short-term level. A bullish move above this level could open the door to a recovery towards 21270.71, or even higher if the supply is absorbed. Conversely, a break below the yearly open (21085.24) would invalidate the bullish scenario and activate a deeper bearish move toward 20915.95 and 20784.26.
Technical Summary
Bullish Scenario:
Price must break above the 21116.65 POC with strong momentum. If confirmed, an upside push towards 21270.71 is expected. However, that zone remains a key supply area, so partial profit-taking or securing long positions is advisable before potential bearish reactivation.
Bearish Scenario:
If price decisively breaks below the yearly open at 21085.24, a bearish continuation setup is activated. Targets for this move include the 20915.95 and 20784.26 support levels. This scenario would be invalidated if price reclaims the POC with strong volume.
Exhaustion/Reversal Pattern (ERP): Before entering trades at the key levels mentioned, always wait for the formation and confirmation of an ERP on the M5 timeframe, like the ones explained here 👉 https://t.me/spanishfbs/2258
Untraded POC: POC = Point of Control is the level where the highest volume concentration occurred. If the price moved down from that area previously, it is considered a sell zone and acts as resistance. Conversely, if a bullish impulse originated there, it is seen as a buy zone and typically aligns with support levels.


